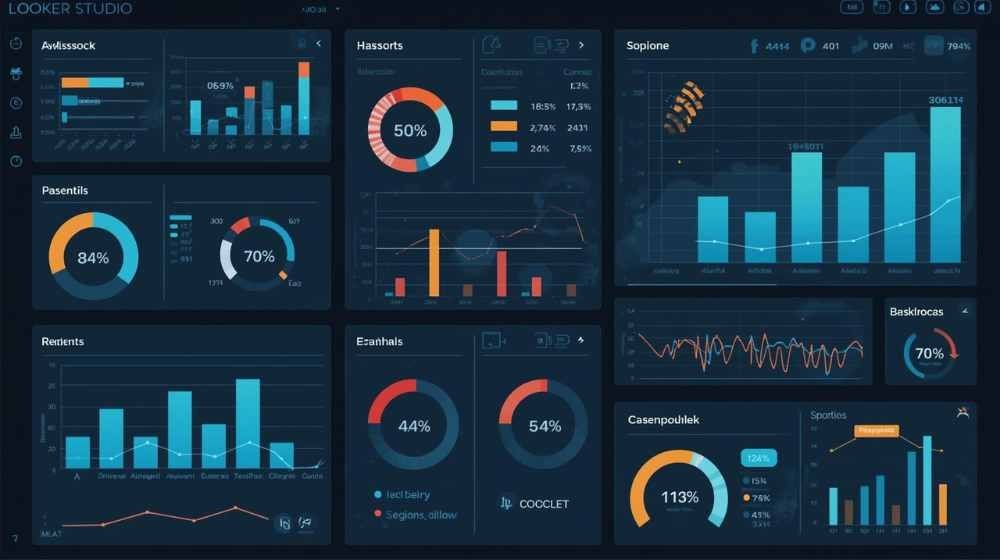
A Looker Studio dashboard can look polished while still showing incomplete or misleading information. Missing dates, broken connectors, incorrect filters and tracking errors may remain hidden behind attractive charts.
Artificial intelligence can speed up the audit process by scanning exported data, comparing patterns and highlighting unusual changes. However, AI should support human analysis, not replace source-level verification.
Quick Answer
To find data gaps with AI, export your Looker Studio data and ask an AI tool to check for missing dates, null values, sudden drops, duplicate rows and inconsistent metrics. Verify every finding against the original source, such as GA4, Google Ads, Search Console or BigQuery, before changing the report.
What Is a Data Gap in Looker Studio?
A data gap is any missing, incomplete or inconsistent information that affects the accuracy of a dashboard. It may appear as an empty date, a zero value, a broken chart or an unexplained fall in performance.
Some gaps are easy to see. Others appear only after comparing the Looker Studio report with its original data source.
Common examples include:
- Missing days in a time-series chart
- Blank campaign or landing-page names
- Zero conversions despite active campaigns
- Sudden drops in traffic
- Duplicate rows after blending data
- Different totals in GA4 and Looker Studio
- Charts using inconsistent date ranges
- Filters that affect only part of a report
- Calculated fields returning errors
- Data that has not refreshed recently
A visible drop is not always a real performance problem. It may be caused by a tracking change, connector failure or reporting configuration.
Why Looker Studio Reports Develop Data Gaps
Looker Studio does not create most business data itself. It connects to platforms such as Google Analytics, Google Ads, Search Console, Google Sheets and BigQuery.
If the source contains incomplete information, the report will usually reflect that problem. A connector can also fail, a field can change or a filter can remove valid records.
Broken or Expired Connectors
Third-party connectors may lose authorization, reach an API limit or stop supporting a field. A chart can then show old information, an error message or no data.
Reconnect the source and confirm when it last refreshed. Do not assume that a visible chart is using current data.
Incorrect Date Ranges
A chart may use a different date range from the rest of the report. One scorecard might show the last 28 days while another displays the current month.
This can create an apparent difference even when both charts are technically correct. Standardize the reporting period before comparing metrics.
Tracking Changes
GA4 events, Google Tag Manager containers, cookie settings and website forms can change. If an event name or tracking rule is edited, historical and current data may no longer align.
Record important tracking changes in a separate log. This gives analysts context when AI detects a sudden break in a trend.
Data Blending Problems
Blended data combines information from two or more sources. Differences in join keys, date formats or naming conventions can remove or duplicate rows.
For example, one source may use “Google” while another uses “google.” A case-sensitive join may treat them as different values.
Null and Blank Values
A null value means the expected information is absent. A blank dimension can also appear when an analytics platform cannot identify a campaign, page or user attribute.
Replacing every null with zero can hide the real issue. First decide whether the value is missing, unavailable or genuinely zero.
How AI Helps Find Reporting Gaps
AI can review a large dataset faster than a person checking rows manually. It can group errors, recognize repeated patterns and suggest possible causes.
Useful AI-supported tasks include:
- Finding missing dates
- Counting blank fields
- Detecting sudden spikes and drops
- Comparing totals across sources
- Identifying duplicate records
- Reviewing calculated-field logic
- Explaining unusual metric changes
- Creating validation rules
- Producing a prioritized audit checklist
AI works best when the dataset has clear field names, a consistent date format and enough historical information for comparison.
Step 1: Define What the Report Should Contain
Before using AI, write down the purpose of the dashboard. A marketing report, for example, may need traffic, leads, conversions, campaign costs and revenue.
Create a simple list of required fields:
- Date
- Data source
- Campaign
- Channel
- Sessions
- Users
- Leads
- Conversions
- Cost
- Revenue
This list becomes the expected structure. AI cannot reliably identify missing information if it does not know what should be present.
Also define the expected reporting frequency. A daily dashboard should normally contain one record or aggregated result for every date in the selected period.
Step 2: Check the Looker Studio Report Manually
Start with a visual review before exporting anything. Open every report page and look for obvious errors or unexpected changes.
Check the following:
- Do all charts load?
- Are scorecards showing values?
- Are date controls working?
- Do filters affect the correct charts?
- Are comparison periods consistent?
- Are any dimensions blank?
- Does the report show a recent update?
- Are totals close to the source platform?
Write down every suspicious chart. AI analysis becomes more useful when it begins with a clear question rather than a vague request to “check the dashboard.”
Step 3: Export the Relevant Data
AI usually cannot understand a private Looker Studio dashboard unless it has authorized access. The safer method is to export only the necessary chart or table data.
Depending on the report permissions, select a chart and use its export option to download the information as CSV or another available format.
Before uploading data to an external AI service, remove:
- Names
- Email addresses
- Phone numbers
- Customer identification numbers
- Payment information
- Private campaign details
- Health or financial records
- Confidential company information
Never upload sensitive business data without checking your organization’s privacy, security and AI-use policies.
Step 4: Ask AI to Check for Missing Dates
Missing dates are among the easiest gaps to identify. They may appear when a connector fails or no records are returned for a particular day.
A useful prompt is:
Review the Date column from [start date] to [end date]. List every missing date, duplicate date and invalid date format. Do not estimate missing metric values.
This wording tells the AI what to inspect and prevents it from inventing replacements.
When a date is missing, check whether:
- Tracking stopped
- The website had no activity
- The connector failed
- A filter removed the data
- The source uses another time zone
- The date field has the wrong format
Do not automatically fill the missing day with zero. Zero activity and unavailable data are different conditions.
Step 5: Detect Null Values and Blank Dimensions
Ask the AI to count missing values by column and calculate the share of affected rows. A field with a high percentage of blanks may indicate a tracking or classification problem.
Use a prompt such as:
Count null, blank and “not set” values in each column. Show the affected row count and percentage. Separate true zeros from missing values.
This can reveal missing campaign names, incomplete source data or pages without a recognized title.
After AI identifies the fields, confirm the result in the original spreadsheet, database or analytics platform.
Step 6: Find Sudden Drops and Spikes
AI can compare each day or week with a recent baseline. This helps identify unusual movement that may require investigation.
Ask it to flag changes above a reasonable threshold, but do not tell it that every change is an error.
A strong prompt is:
Compare each day with the previous seven-day average. Flag changes greater than 40%. For each anomaly, show the date, metric, actual value and baseline. Do not claim a cause without evidence.
Large changes may result from:
- A successful campaign
- A tracking failure
- Website downtime
- Seasonal demand
- A viral post
- Bot traffic
- A budget adjustment
- A major event
- A reporting delay
AI can identify the anomaly, but source records are needed to confirm the reason.
Step 7: Compare Looker Studio With Source Platforms
A reliable dashboard audit includes reconciliation. Compare important Looker Studio totals with GA4, Google Ads, Search Console or the original database.
Use the same:
- Date range
- Time zone
- Filters
- Attribution settings
- Metric definitions
- Account or property
- Currency
For example, GA4 users should not be compared directly with Google Ads clicks. Both may describe audience activity, but they measure different actions.
If the same metric differs, ask AI to calculate the numerical and percentage variance. Then investigate metric scope, aggregation, sampling, filters and data freshness.
Step 8: Review Calculated Fields
Calculated fields may create hidden errors when formulas use the wrong conditions or divide by zero.
Export the formula definitions and ask AI to review them for:
- Incorrect operators
- Missing conditions
- Mixed data types
- Unsafe division
- Wrong aggregation
- Inconsistent field names
- Logic that excludes valid records
AI can suggest a correction, but test that suggestion on a copy of the report. A formula that looks correct in plain language may behave differently inside Looker Studio.
Google’s documentation also warns that Gemini-generated results can appear reasonable while still being factually incorrect. Every formula and AI-generated insight should be validated before use.
Step 9: Audit Filters and Date Controls
Filters can create gaps without showing an error. A chart may appear complete even though a page-level or report-level filter has removed important information.
Check for:
- Excluded traffic sources
- Country restrictions
- Device filters
- Campaign filters
- Internal traffic exclusions
- Incorrect regular expressions
- Controls linked to only some charts
When a report uses several data sources, the same filter may not work across every chart if field identifiers or data types differ.
Test filters one at a time. Compare the report before and after each control is applied.
Step 10: Use AI to Prioritize the Problems
Not every gap has the same business impact. A missing color label is less serious than missing revenue or conversion data.
Ask AI to group findings by priority:
Critical: Missing revenue, conversions, security-related data or broken core connectors.
High: Large date gaps, major source differences or incorrect calculated fields.
Medium: Blank campaign dimensions, smaller inconsistencies or delayed refreshes.
Low: Formatting issues and labels that do not change decisions.
The final priority should be reviewed by someone who understands the business. AI does not know which KPI matters most unless that context is provided.
Useful AI Prompts for a Looker Studio Audit
Use specific prompts instead of asking for a general review.
Missing-data prompt:
Find missing dates, null values, blank dimensions and duplicate rows. Show evidence from the dataset and do not fill missing values.
Anomaly prompt:
Identify unusual changes using the previous four weeks as a baseline. Separate likely data-quality issues from possible real performance changes.
Source-comparison prompt:
Compare Dataset A and Dataset B by date and metric. Calculate the difference and percentage variance. Do not combine rows with unmatched keys.
Calculated-field prompt:
Review these Looker Studio formulas for division-by-zero errors, incorrect conditions and mixed data types. Explain each suggested change.
Action-plan prompt:
Turn the confirmed findings into a prioritized repair plan. Include the issue, likely location, verification step, owner and completion status.
These prompts encourage evidence-based output and reduce the risk of unsupported AI conclusions.
AI Mistakes to Avoid
AI can save time, but careless use may create new reporting problems.
Avoid:
- Uploading private customer data
- Accepting invented explanations
- Allowing AI to estimate missing revenue
- Changing formulas without testing
- Treating correlation as the cause
- Comparing metrics with different definitions
- Ignoring source-platform totals
- Using AI output without human approval
A confident response is not proof of accuracy. Keep the original export and document every change made to the dashboard.
A Practical Data-Gap Workflow
A dependable Looker Studio quality process can follow this order:
- Review the dashboard visually.
- Confirm connectors and refresh dates.
- Standardize date ranges and filters.
- Export non-sensitive data.
- Use AI to find missing values and anomalies.
- Verify each issue in the original source.
- Repair the connector, field, filter or formula.
- Test the report again.
- Record the change and review date.
- Schedule the next audit.
This process combines AI speed with human judgment and source-level evidence.
Final Thoughts
AI can make Looker Studio audits faster by finding missing dates, blank values, duplicate records and unusual metric changes. It is especially useful when a report contains many pages or large exports.
The most important step is verification. Looker Studio, the source platform and the AI output should be compared before any business decision is made.
Treat AI as an audit assistant rather than the final authority. Clean source data, consistent metric definitions and documented checks are still the foundation of a trustworthy dashboard.